Does batching beat grabbing the nearest driver? I simulated San Francisco to find out
MetroSim, a ride-hailing dispatch simulator on San Francisco's road network, and what a paired A/B of greedy vs. batch matching actually showed once I fixed my own bug.
Updated September 2026. The first version of this post said batch matching won at normal demand: 35.7% of riders picked up against 22.1%, and a 10-second lower wait. That result was a bug. Greedy was ranking drivers by straight-line distance while batch ranked them by road time, so I had handicapped the baseline and called it a finding. With both policies scoring drivers the same way, batch is slightly slower at normal demand and only pulls ahead once riders start queueing for cars. Every number below is from the rerun, and the old claims are gone.
A ride request comes in. Which driver do you send?
The reflex is the nearest free car. It's one line of code and it's what everybody writes first. The other option is to sit on the request for a few seconds, let a pile of requests and drivers build up, and match the whole pile at once. That rider two blocks from a car might not get that car, but the batch as a whole comes out ahead.
Or so the story goes. Every dispatch talk repeats it. I wanted to know if it's actually true, by how much, and whether the gap would survive someone squinting at the statistics. So I built a simulator, dropped it on a real city, and ran both policies against each other. Then I found a bug in my own comparison, fixed it, and watched the answer flip.
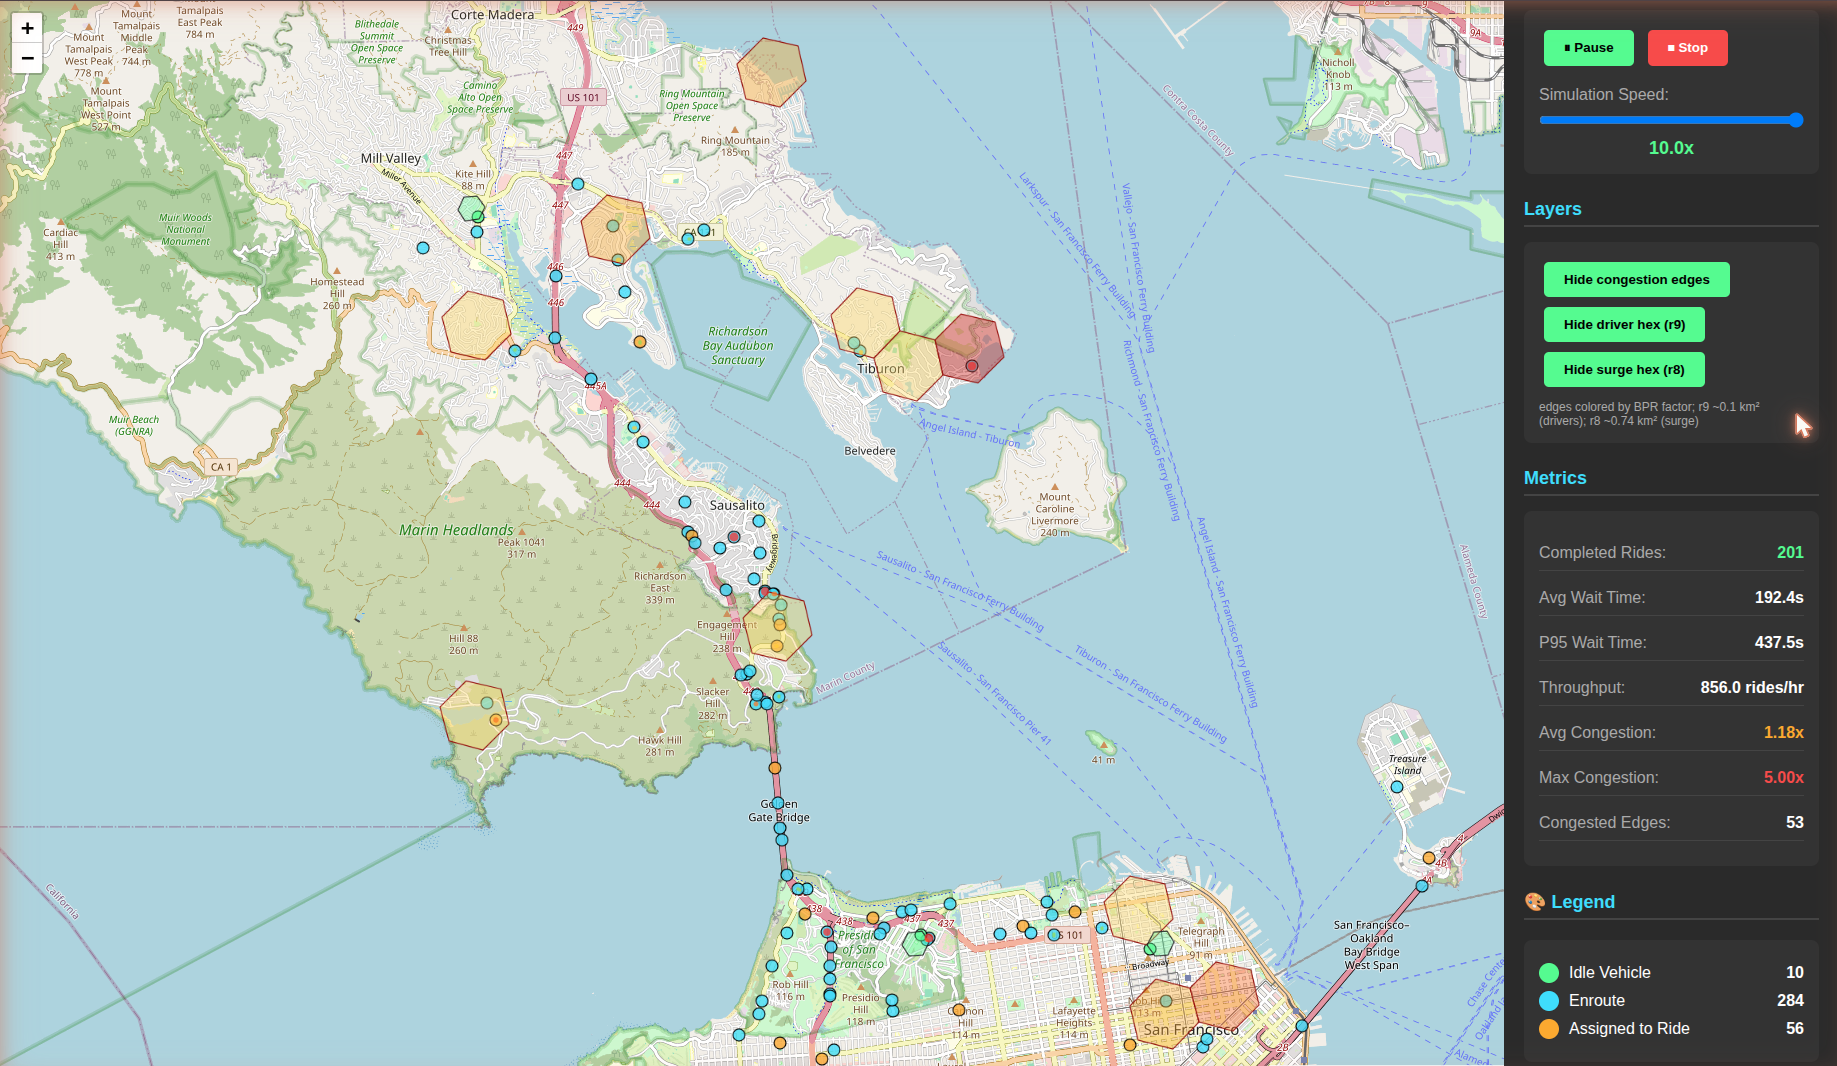
MetroSim across the Bay Area at 10× speed. The H3 cells are shaded by driver density (green through red), and the panel tracks the live marketplace: completed rides, throughput, and congestion climbing to 5× on the busiest edges.
A real city, not a grid
Most dispatch demos run on a tidy grid of square blocks. Convenient, and also a lie. Real roads are one-way, they dead-end, they climb hills, and they jam at rush hour. So MetroSim skips the grid and pulls San Francisco straight out of OpenStreetMap. The raw extract is 256k nodes and 470k edges, and a surprising amount of that is junk at the edges of the map: dead ends, one-way traps, fragments where the cut went through a road. The loader keeps only the largest strongly connected component, which leaves 240,128 nodes and 440,814 edges where every node can reach every other. That matters more than it sounds. Without it, a random pair of real addresses sometimes has no route at all, and the sim quietly loses riders.
Drivers live in H3 cells, the hexagon grid Uber open-sourced, so finding cars near a request is a cheap lookup across a handful of hexes instead of a scan over every driver in the city. Requests arrive as a seeded Poisson stream, and that seed does the heavy lifting in everything that follows: the same seed gives both policies exactly the same riders, at the same second, asking for the same trips. Skip it and you can't tell a real effect from the simulator having a good day.
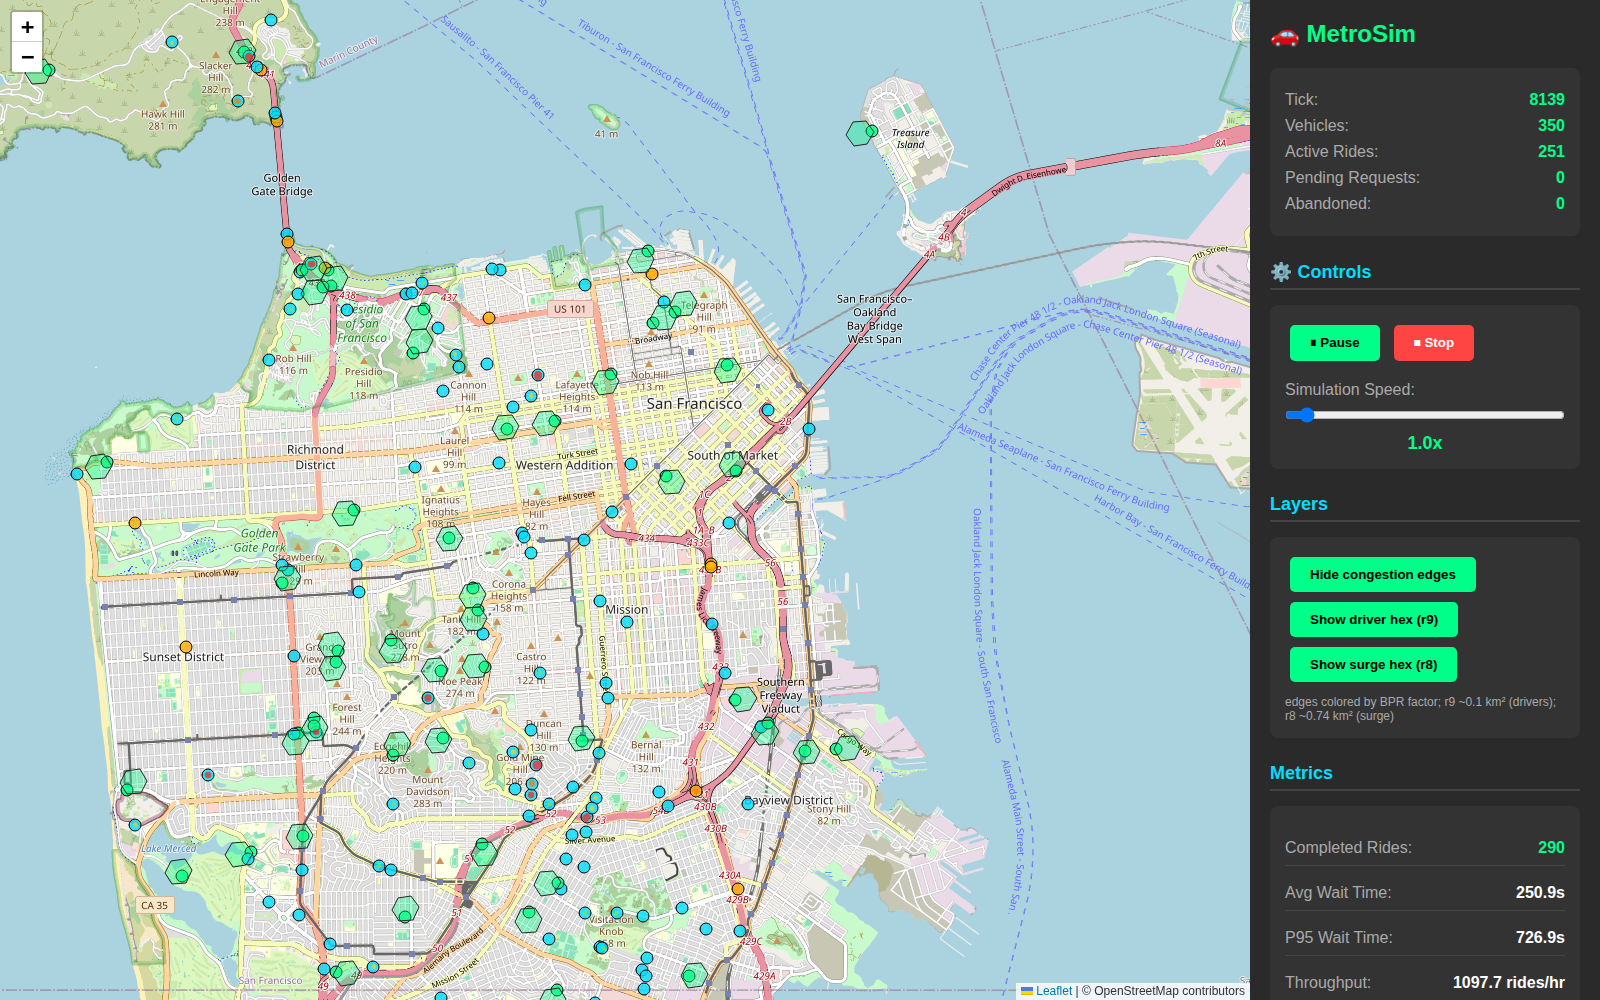
Downtown, mid-run. Each dot is a vehicle, the green hexes are the H3 driver-density overlay, and the panel on the right is the live marketplace: active rides, completions, throughput.
Routing is A* on travel time, with a heuristic I deliberately weighted. The admissible estimate (straight-line distance over the fastest speed limit in the graph) never overestimates, so it returns optimal routes, but it's so loose on ordinary streets that A* fans out almost like Dijkstra. Multiply it by 3 and the search collapses: routes are capped at 3x optimal by construction, come out 11% above optimal on average over 100 random pairs, and the p95 search takes 19 ms against 137 ms for the plain admissible version. The common shortcut of using raw distance in meters as the heuristic, which is what I did first, behaves like a weight of about 29 and hands you routes 70% slower than optimal. Fast, and wrong enough to matter.
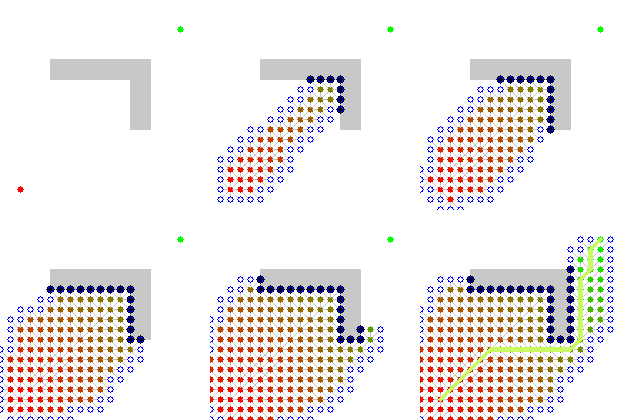
How A finds a route: it fans out from the start (red) toward the goal (green), always leaning toward nodes that look closer, until it locks onto the shortest path. MetroSim runs a weighted version of this on the live congestion-weighted SF graph. Source: Wikimedia Commons (CC BY-SA).*

Every step of a trip is a proto3 event: request, match, pickup, dropoff, and the cancellations and abandonments in between. Inside one process they go over a synchronous in-memory bus. With --bus=kafka they go to Kafka instead, where a trace writer turns them into Parquet, an aggregator serves Prometheus, and the live map above rebuilds its picture of the fleet from the stream. The part I actually care about is what happens when things go wrong. The trace writer commits Kafka offsets only after a Parquet file is synced to disk, a rebalance waits for the batch in hand, and a second replica skips trips the first one already wrote, so a crash mid-batch means redelivery and a dedup skip, not a hole in the data. And publishing never waits on Kafka: if the broker is unreachable long enough to fill the producer's buffer, about a minute of events from 180 cars, the simulator drops events, counts them in a metric, and keeps running. I'd rather lose a minute of traces than stall the experiment.
The two policies
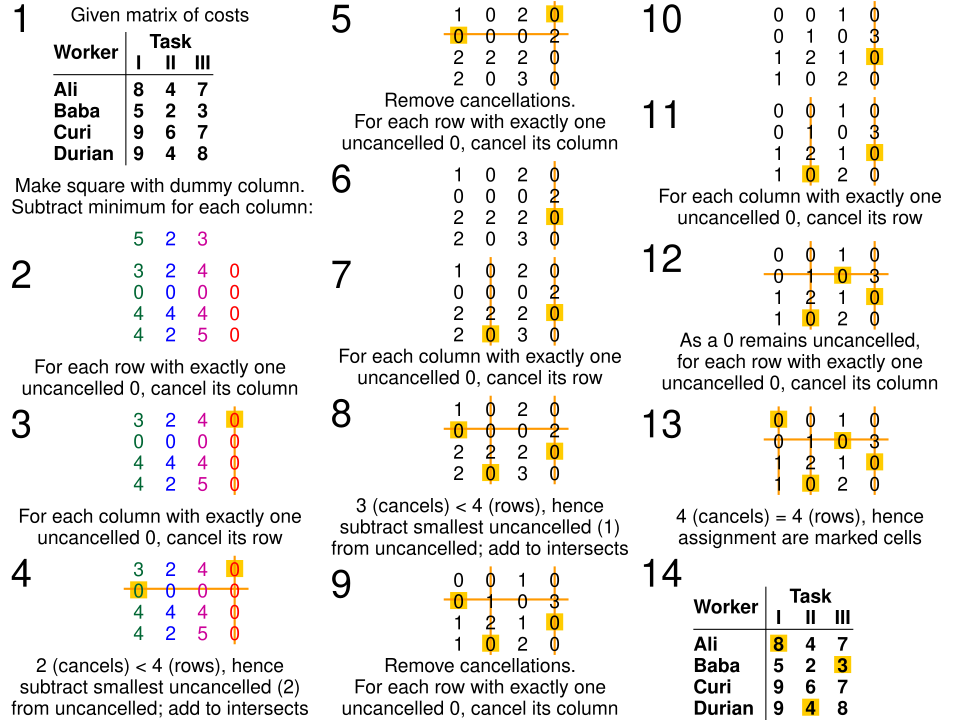
The Hungarian algorithm the matcher runs, worked end to end: reduce the cost matrix, cover the zeros, read off the minimum-cost assignment. In MetroSim the workers are drivers and the tasks are ride requests. Source: Wikimedia Commons (CC BY-SA).

Greedy takes requests in arrival order. For each one it looks at the five nearest free drivers and hands the request to whichever of them can reach it soonest by road. Five instead of one so an unreachable nearest driver, stuck on the wrong side of a one-way, doesn't strand a rider.
Batch waits. It holds a three-second window, routes every pending request to its five nearest idle drivers, and solves the whole window as one minimum-cost assignment with the Hungarian algorithm, the standard O(n³) version. Each window gets the globally cheapest assignment instead of a scramble of nearest-grabs.
Both policies score a driver by the same routed pickup time. That sentence is the whole experiment, and it's the sentence I got wrong the first time.
The bug that faked the win
The first version of greedy ranked drivers by straight-line distance. Batch ranked them by road time. On San Francisco's streets those are very different numbers: the driver who looks closest as the crow flies is often across a one-way or up a hill you can't cut through. So greedy kept picking the wrong car, batch kept picking the right one, and the comparison showed batch 16 seconds faster at normal demand. I wrote a post about it. It's the one you would have read here in July.
The gap was the ranking, not the batching. Once greedy scored its candidates by routed pickup time too, the 16 seconds vanished, and what was left is the table below. The lesson isn't subtle, and I'll say it plainly because I fell for it: before you conclude your clever policy beats the baseline, check that the baseline isn't quietly running on worse information.
Making the comparison honest
One run tells you nothing, and a pile of runs pooled together can tell you something false. The first version of this analysis pooled every trip across ten runs and ran a two-sample test on thousands of waits as if they were independent. They aren't. Trips in the same run share the same arrivals and the same traffic. Pooling them inflates the sample size and hands you a p-value with far too many zeros in it.
The rerun is paired. Ten seeds, and each seed produces the same riders for both policies, so the honest unit is the per-seed difference: batch's mean wait minus greedy's, for that seed. Ten differences, a t-interval across them, and a sign test on how many seeds went each way. The intervals are wider than the old ones. They're also true.
Every rider counts, including the few never picked up, who count with the time they had waited when the run ended. That understates their wait, but leaving them out would flatter whichever policy strands more people.
What came out
The downtown scenario: one simulated hour, 180 cars, pickups concentrated in the Financial District, SoMa, the Mission and the Marina, and demand scaled from its normal rate up to double. A hundred one-hour runs, about six minutes on eight cores.
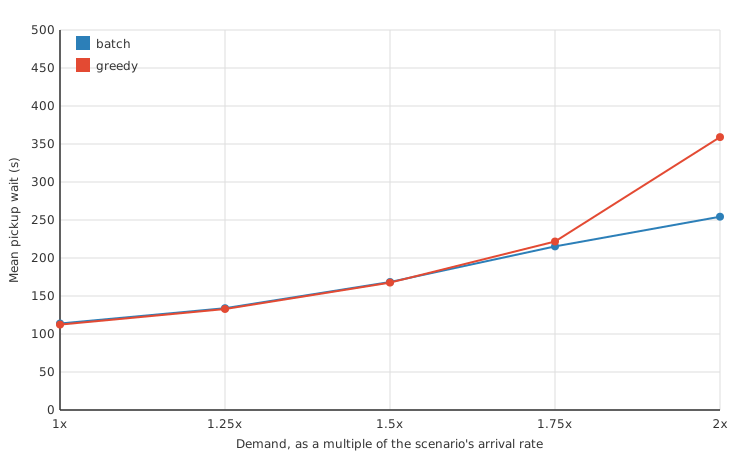
Mean pickup wait by demand level. At normal demand the two lines sit on top of each other with batch a hair higher. They only separate once riders start queueing for cars.
| demand | requests an hour | greedy mean wait | batch mean wait | batch minus greedy, 95% CI | batch faster in |
|---|---|---|---|---|---|
| 1x | 426 | 112.4 s | 113.8 s | +1.4 s [+1.1, +1.7] | 0 of 10 seeds |
| 1.25x | 529 | 132.9 s | 134.0 s | +1.1 s [+0.6, +1.6] | 1 of 10 |
| 1.5x | 639 | 167.6 s | 168.4 s | +0.8 s [-1.9, +3.4] | 2 of 10 |
| 1.75x | 748 | 221.7 s | 215.3 s | -6.2 s [-11.8, -0.6] | 8 of 10 |
| 2x | 857 | 359.0 s | 254.4 s | -103.0 s [-157.0, -48.9] | 10 of 10 |
At normal demand batch loses, and it loses in every one of the ten seeds. The reason is almost embarrassing once you see it. A three-second window at that arrival rate collects 0.35 new requests on average. There's rarely a second request in the window to trade drivers with, so the solver has nothing to optimize, and holding each request for up to three seconds is pure tax. Batch pays 1.4 seconds for the privilege of doing nothing. Both policies pick up 100% of riders here, so the old completion-rate story, the 35.7% against 22.1%, was never about a normal city. It was about a starved one.
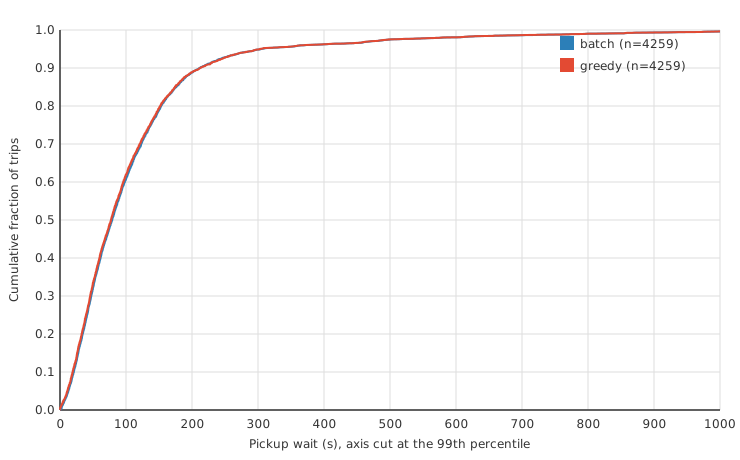
Pickup-wait CDF at normal demand. The two curves are nearly indistinguishable, and batch is the one slightly to the right.
Push demand up and the backlog builds. Requests start waiting for a free car, and now a window holds several of them competing for the same few drivers, which is exactly the situation the Hungarian solver exists for. Batch is still slower at 1.25x, level at 1.5x, and ahead from 1.75x. At double demand it cuts the mean wait by 103 seconds, pulls p95 from 1,105 seconds down to 783, and wins all ten seeds by anywhere from 6 to 235 seconds.
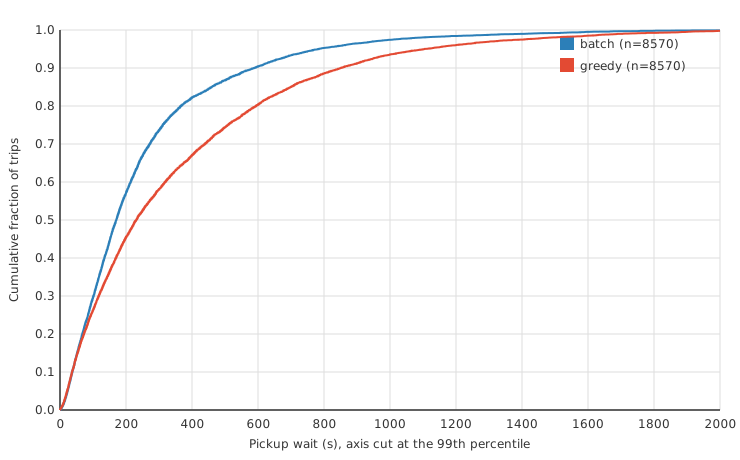
The same CDF at double demand. Now batch sits well to the left across the whole distribution, and the tail is where the gap is widest.
So the honest answer to the title is: it depends on how busy the fleet is. Batching is a tax when cars are plentiful and a lifeline when they aren't, and the crossover on this map sits somewhere between one and a half and one and three quarter times normal demand.
Moving idle cars beat clever matching
What actually helps at normal demand isn't a smarter matcher. It's not letting cars sit where they dropped someone off. With repositioning on, a car that has been idle for two minutes drives toward the H3 cell within about 2.5 km where the last fifteen minutes of pickups most outnumber free cars, as long as that cell is at least two cars shorter than its own, and it can still be matched on the way.
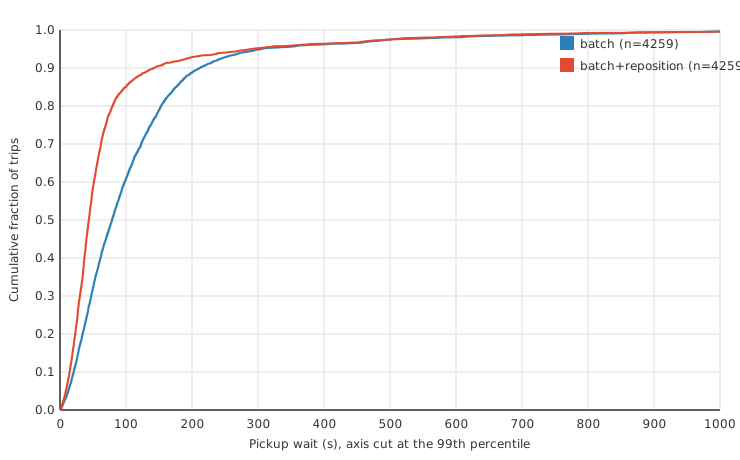
Batch with and without repositioning, same ten seeds. The whole distribution shifts left.
On the same ten seeds, batch's mean wait drops from 113.8 seconds to 79.1. It wins every seed, with a mean per-seed difference of 34.7 seconds and a t-interval from 37.0 down to 32.4. The median wait falls by 35.2 seconds. So the cleverest matcher in the project moved the needle by a second, and moving cars moved it by thirty-five.
It isn't free, and the report says so. Cars made about 600 repositioning trips per run, 3.3 per car per hour, and drove 1,347 km empty doing it, which is 29% of all their driving. Nothing in the sim weighs those empty kilometers against the time saved, and the settings aren't tuned. It's a first cut that happened to be worth thirty-five seconds.
The parts I won't pretend about
The headline compares matching alone, with repositioning off, so idle cars stay wherever they dropped someone. Riders don't react to prices and drivers have no preferences of their own. Nobody cancels because the window annoyed them, which in the real world is the thing that would punish batch hardest.
Congestion is a BPR curve on density, cars on a link against how many fit, and it's steeper than the textbook curve on purpose (alpha 1 and beta 2 instead of 0.15 and 4, capped at 5x) so that a fleet of 180 can congest anything at all. There's no background traffic. In practice only the fleet can jam a road, and 180 cars spread over a city rarely do.
Routes are within 3x of optimal by construction, and in the 100-pair test the worst one took 54% longer than the best path. The trace writer's dedup remembers the last 100,000 trips, so a trip redelivered after it ages out gets written twice. And if Kafka is unreachable for over a minute, the events published in that window are gone from the traces and metrics. Losing none would take a durable outbox in front of the producer, which I haven't built.
The one thing I'll stand behind flat-out is still the matcher. The Hungarian solver is checked against brute force on 50 random cost matrices plus seven edge cases picked to break it. The assignment inside each window is exact. Everything around it is an approximation, and every experiment report records the command and commit that produced it, so you can rerun any number on this page and see whether it holds.
What I'd change, and what changed me
The old version of this section said batching wasn't free and that impatience and cancellations would make the answer more conditional. That turned out to be an understatement. The answer got conditional before I added a single one of those. It got conditional the moment I stopped giving batch better information than greedy.
Which is the actual headline, if I'm being straight. Batch matching isn't a law. It's a bet that there's a backlog to optimize, and at normal demand on this map there isn't one. Under load the bet pays enormously, and nothing else in the project touches the tail at double demand. Below that, park the solver and move the cars.
The result was never the interesting part. Building something I trusted when it handed me a number was. Trusting it enough to let it overturn my own post, that part I didn't plan for.